Choose your language

Choose your language

The website has been translated to English with the help of Humans and AI

Dismiss

Prepare Your Data Strategy for the Shift to Personalization

Prepare Your Data Strategy for the Shift to Personalization

3 min read
Profile picture for user mediamonks

Written by
Monks

Recently, the FIAP Awards kicked off for four days of talks, Q&As and insights on advertising and communications.

If you’re not familiar with FIAP (Festival Iberoamericano de Publicidad), it’s one of the leading creative events in Latin America, hosted in Buenos Aires and home to one of our offices. This year’s edition featured several key speakers including Sir Martin Sorrell of S4 Capital and MediaMonks founder Wesley ter Haar.

One of the recurring themes throughout the conference was the challenges brands face in using data effectively, creatively affordably. If this sounds relatable, get up to speed on these big ideas surrounding the opportunities that data affords.

FIAP-SMS

Budgets are tight, and the appetite for content isn’t slowing down.

“Nowadays you need more for less. There’s a constant need for content, but budgets are getting smaller.” – Wesley ter Haar

In his tongue-twisting talk “Ten Techtonic Trends,” Wesley ter Haar pointed out that marketing budgets peaked in 2016, only to fall the following year. Despite stagnant and decreasing budgets, the drive for content is always increasing as is the demand to provide more personalized, custom experiences. And if that doesn’t sound difficult enough, the challenge is expounded by an explosion of new forms of media: AR/VR experiences, live video, 360-degree video and more. Those in fear of missing out on the next big media platform might scramble to develop content for each, but this can be difficult to afford and organize. When producing so much content for so many different platforms, it’s easy for everything to feel a bit disconnected. That’s why it’s important to switch up your mentality and framework (find out how below).

Developing assets at scale is one way to satiate the growing hunger for content. It’s a process and creative framework that involves developing hundreds, thousands or maybe billions of unique assets tailored to hyper-specific segments in your market with only a handful of pieces of content. But how can organizations pull it off affordably? The answer lies in changing their way of thinking, which brings us to our next big idea:

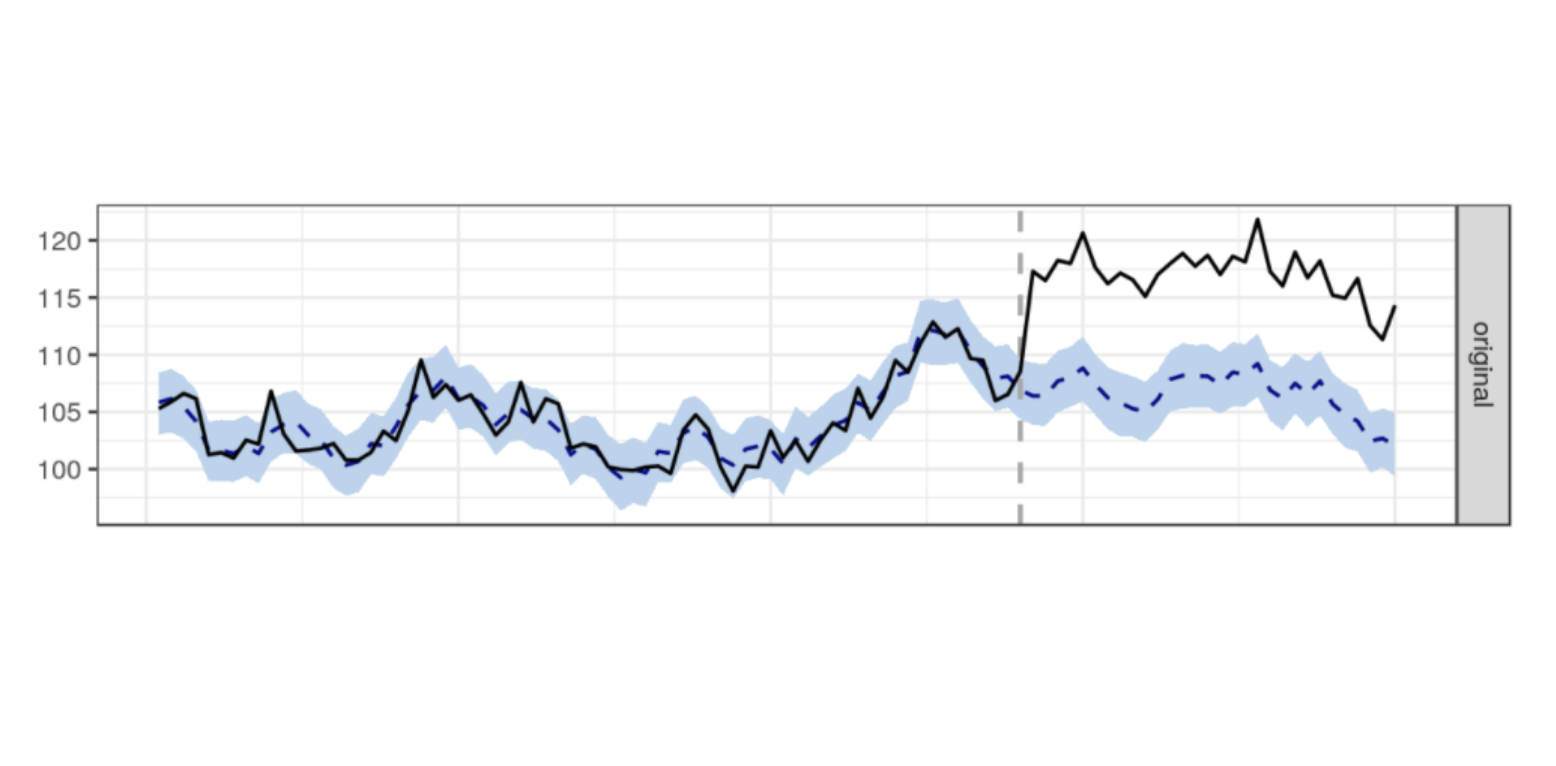
Brands must integrate data and analytics throughout the creative process, not just at the end.

“Data is information, and information is power. What gives you the difference is to interpret it and know how to use it … and use it as a basis to create something.” –Eva Santos

Santos touched upon a key idea from FIAP: that relegating data and analytics to the end of the creative cycle is obsolete. Instead, agencies must incorporate data into every step of the creative process. Sir Martin Sorrell had a similar message when he said: “Data will inform creative and it will inform media planning. It will make them better, it won’t make them worse.”

Monk Thoughts Data will inform creative and it will inform media planning. It will make them better, not worse.
Headshot of Sir Martin Sorrell

Sir Martin Sorrell used the example of Netflix recommendations, which surface up customized posters and dynamic trailers tailored to audiences’ unique preferences. It’s easy to see how this makes content compelling, but it’s also a smart and economical way to generate tons of assets with relatively few pieces to begin with: with just 115 scenes and 3 intro animations, you could make almost 1.5 million pieces of content.

FIAP-Wesley AAS

But this requires a bit of rethinking your strategy, too. Assets at scale rely on content frameworks punctuated with dynamic variables. So rather than developing a different piece of content per segment or interest, you simply develop a framework which you can use to test, scale and create more content without an added cost.

Demographics are dead; long live preferences.

“Demographic information doesn’t give us anything, it’s all about the users’ preferences.” – Wesley ter Haar

Bad news: demographics like geography, age or gender are dead. Good news: with today’s technology, delivering on user preferences is king. Ter Haar elaborates on the idea in his talk by giving us an example. Consider a young girl on the west coast who loves Breaking Bad. She has much more taste in common with other fans of the show—like an older man in Kentucky who’s also obsessed with it—than with other girls in her community who hate the show.

The next big battleground is personalization and context, which means both new and legacy brands will need to revise their data strategies to stay on top. And the stakes are high:  Adobe predicts that $800 billion will go to the top 15% of companies alone who get the formula right. That makes now more important than ever to get an effective data strategy in place.

#FIAP2018 has come and gone, but it’s not too late to gain some insights from the conference. Here are four big ideas on how data is shaking things up and changing the game. Prepare Your Data Strategy for the Shift to Personalization #FIAP2018 has come and gone, but it’s not too late to gain some insights from the conference. Here are four big ideas on how data is shaking things up and changing the game.
FIAP FIAP2018 Sir Martin Sorrell S4 Capital Wesley ter Haar data creative content programmatic content data analytics data is an opportunity

Why You Need to Start Using Google Analytics 4

Why You Need to Start Using Google Analytics 4

4 min read
Profile picture for user doug_hall

Written by
Doug Hall
VP of Data Services and Technology

Why You Need to Start Using Google Analytics 4

Announced by Google in October, Google Analytics v4, or GA4, has received a lot of attention. The level of excitement generated by the announcement reflects how significant this version of Google Analytics is. Exciting new features include:

  • A flatter, event based, user-oriented data model
  • A new reporting interface to reflect changes in the data model
  • One reporting interface for first-party data collected across devices
  • Machine-learning-powered insights and predictions
  • Audience triggers and conversions

You probably have a mature, stable GA implementation already so you need to consider the reasons to adopt GA4 now; streaming data into BigQuery in near real time, combining your first-party analytics data streams, and activating the data in remarketing audiences. Imagine this kind of data collection, processing, and activation functionality available now, for free.

Top Four Migration Myths About GA4

Despite the previously listed features, you might still have reasonable and valid concerns over seemingly drastic changes to your analytics setup.

We understand these reservations. You’ve invested in analytics, your business has a reliance on data, you don’t want to rock the boat with cost, risk, and complexity.  

Here are the four most common misconceptions about GA4 and the reality of the situation that should put your mind at ease.

1. GA4 will require extensive retagging of your site / app

GA4 requires a single tag and no additional code on your current property.

2. GA4 will affect your current GA implementation

An implementation of GA4 has no impact on current data collection or existing tagging.

3. GA4 requires additional budget for BigQuery

There is no cost or additional GCP costs with the free tier.

4. GA4 requires an additional DV360 license

GA4 has no impact on 360 billing nor does it require additional licenses.

The launch of GA4 is a great opportunity to revisit your digital measurement from the ground up, starting with a Minimum Viable Product (MVP).

The GA4 MVP

Here’s the bare bones proposition of dipping your toe in the GA4 water:

1. 30-minute setup - GA4 Property + streams config, GTM, BQ on GCP

2. One tag - NO CODE

3. No impact on current data collection

4. No impact on 360 billing

5. No GCP Billing

6. No changes to your site code

That’s a low risk, low skilled, low cost GA4 deployment. GA4 doesn’t mess with your existing GA tagging, you can add the tag, keep it in a zone, or just run it in preview mode to explore the DebugView output. 

What’s Possible with Only One Tag?

Just one tag.  Yes. Seriously – this is IT:

Google analytics interface showing a ID tag

The GTM summary is as sparse as it gets:

Google analytics interface showing ID tag numbers

Out of the box, one tag can handle:

Plus GA4 introduces the ability to modify and create events.

This means you can take existing page views, page paths, or clicks, and create new events without doing any tagging in GTM.

That means no extra tags just to measure a click on the “Home” button any more. This is a real game-changer for your data collection. There is less tagging happening in the browser and more control for you on the server side. This is better for the user and better for your data. 

For example, there’s no “contact_us” event in GA4.  There’s no tag in GTM to fire this event either but there it is, flagged as a conversion:

Google analytics interface

Where did it come from?  The page_view event, when combined with the page_location property value “/contact/” gives us a new event:

Google analytics interface

This is a bit like setting up goals in “old” GA, but with way more power and flexibility.  

Let’s cover one additional feature that makes the MVP really compelling. Head to the Admin section in your GA4 property, scroll to the bottom of the page, under “Product Linking” – go and set up the BigQuery linkage to start streaming your data into a cloud data store:

Google analytics interface

Access to your raw data in near real time gives you the ability to perform workloads on the data, join with other data sources, and activate it. Realize the value of the data isn’t just in the excellent reporting capability.

Furthermore, you will find that the BigQuery data has a degree of richness not apparent in the reporting interface. At the time of writing, the published quota limits apply to the reporting interface – not the data collection. You may have exceeded the number of custom dimensions and can’t see all your data in the reports.  ALL the data is collected though, and you will see this in the BigQuery export.

Start Your GA4 Journey Now

The power, flexibility, and feature richness of GA4 effectively eases the concerns over tagging, change, effort, complexity, and budget.

Plus, the volume and quality of online resources from Google and from the analytics community is growing faster than ever before. You won’t be alone in your journey. 

Start your GA4 journey as soon as possible to kick start the investment in your analytics future. See this as an opportunity to review and realign your analytics measurement with your business strategy. Consider the power of automatic, and enhanced analytics, combined first party data sets from your apps and your websites. The sooner you start streaming the data into BigQuery, the sooner you can build a robust body of raw data to activate.

The GA4 world is going to be different, and better in many respects. The MVP approach minimizes risk and cost while maximizing learning and value.

A deep dive into the exciting new features of Google Analytics 4 and reasons to adopt GA4 into your practice now. Google data analytics data organization

How to Enrich Your Google Tag Manager Monitor Data with a New Google Analytics Integration

How to Enrich Your Google Tag Manager Monitor Data with a New Google Analytics Integration

4 min read
Profile picture for user jack_pace

Written by
Jack Pace

How to Enrich Your Google Tag Manager Monitor Data with a New Google Analytics Integration

Last year, our favorite Google Analytics and Google Tag Manager expert, Simo Ahava, wrote a great blog post about How to Build a Google Tag Manager Monitor. This tool is extremely helpful for unlocking statistics on site tag fires from various dataLayer event pushes.

Architecture Diagram of GTM Tool Integrated with GA

Many crucial data points used for activation and measurement rely on successful dataLayer pushes. We’ve made a few updates to Simo’s Google Tag Manager Monitor framework that have allowed us to join data with Google Analytics. These updates help us unlock the ability to identify stability issue trends and patterns across devices, browsers, and operating systems that can negatively affect dataLayer pushes. For marketers struggling with data leakage, this is a BIG WIN.


We’ve Been Tinkering


Let’s explore the various adaptations we have made to Simo’s methodology in order to join results from the Google Tag Manager Monitoring Tool with a Google Analytics dataset in BigQuery, and what these enhanced capabilities mean for marketers. The join we’ve created enriches data collected via the Google Tag Manager Monitoring Tool with Google Analytics data points such as device, browser, OS—crucial information in understanding trends and patterns that impact performance. 

This post provides a high-level overview for how adding a new metric to your analytics toolset can help you measure the stability of your analytics implementation. If you’re interested in digging deeper into specifics or discussing real-world use cases, please reach out to me


TECH SETUP

There are a few prerequisites to have in place before joining data from a Google Tag Manager Monitoring Tool with Google Analytics data:

  • Pre-existing implementation of Simo’s Monitoring Tool (use his guide to get started)
  • Access to Google Tag Manager
  • Access to Google Cloud Platform project 
  • Google Analytics 360 Export


Here’s a look at an architecture diagram showing the Google Tag Manager Monitor Tool integrated with Google Analytics:


The Secret Sauce


The MightyHive Data Science team has designed a series of updates to Simo’s monitoring tool to provide enhanced data and diagnostic insights, including updates to the tool template to capture the Google Analytics Client ID, allowing us to join Google Analytics BigQuery data sets. Our team also realized that to connect all events on a given page together, a universally unique identifier (UUID) needed to be set via a new custom HTML tag. 

With the updated Monitor Tool template and the UUID tag set, the team updated the Cloud Function and created a BigQuery Table Schema for the enhanced tool using three additional fields: ga_client_id, event_id, and urlpath.

For a more detailed breakdown of the custom HTML tags we used, key Google Tag Manager settings, and code snippets for the template updates, shoot me an email.   


What Does this Look Like IRL?


A client—let’s call them Company X—published a new version of their site around August 3. Once the updated site was live, Company X noticed that the gtm.load dataLayer event push began to fire later, or in some cases not at all. Because various tags were set to fire on gtm.load, those tags fired less frequently post-release. 

Tracking breaks like this are a marketer’s nightmare. Did the tag fail? Did someone publish an update with broken code or without the all-important dataLayer push? Is the break happening on a specific device, browser, or operating system? These questions and more can lead to a frustrating, time consuming wild goose chase, not to mention lost data until the issue is fixed. 


Calculating the Google Tag Manager Load Rate


To troubleshoot Company X’s misfire, we used a new metric: Google Tag Manager Load Rate.  We’ve calculated the load rate using the following simple formula:


GTM Load Rate Formula


Let’s say Company X has an order confirmation dataLayer event that occurs after gtm.js. Swapping out gtm.load for the order confirmation dataLayer event gives Company X its order confirmation fire rate. 


BIGQUERY GOOGLE TAG MANAGER LOAD RATE QUERY

The Google Tag Manager Load Rate query calculates the fire rate in the following grouping:

  • Device Category - Google Analytics provided device category (desktop, tablet, mobile) 
  • Device Browser - Google Analytics provided device browser (Chrome, Safari, Firefox) 
  • Page Path - Page where the event occured
  • Load Count - Count of gtm.load events
  • JS Count - Count of gtm.js events
  • GTM Load Rate - Load Count / JS Count


Here’s what the query output looks like:


GA Query Output


In this example, using our BigQuery Google Tag Manager Load Rate query, we can quickly see that Company X’s home page, or “/”, has the lowest load rate at 91%. This means that 9% of gtm.loads on the home page did not fire, therefore leading to 9% (!!!) of traffic potentially being untracked. 


Better Insights, Faster Solutions


Our updates to the Google Tag Manager Monitoring Tool help take some of the guesswork out of the equation by automating a solution that audits dataLayer fires to quickly diagnose issues as they arise. By leveraging our version of the tool supplemented with Google Analytics data points, Company X was able to quickly pinpoint a sharp decline in fire rates post-release on Chrome and Firefox, while Safari was unaffected. A speedy and definitive diagnosis helped Company X fix the issue fast, reducing data leakage and bolstering its analytics setup against future issues.


dataLayer Firing Diagnosis

Data Leakage Be Gone!


In advanced analytics use cases, troubleshooting and diagnostics can monopolize an inordinate amount of time and resources, risking massive data leakage until an issue is resolved. Now that we have the ability to join Google Tag Manager Monitor Tool insights with Google Analytics datasets, we can pinpoint when and where dataLayer pushes fail and which devices, browsers, and operating systems they are failing on. For marketers, this means hours, days, or even weeks of time saved and minimal data lost. 

Learn how Google Tag Manager and Analytics can help unlock the ability to identify stability issue trends and patterns across all devices. data analytics data Google

Revisiting Measurement Strategy with the Advent of GA4

Revisiting Measurement Strategy with the Advent of GA4

3 min read
Profile picture for user doug_hall

Written by
Doug Hall
VP of Data Services and Technology

Revisiting Measurement Strategy with the Advent of GA4

Are your measurement strategy and tagging implementation aligned? It's OK, you’re in a safe space here—we know that keeping technology, tactics, and strategy in 100% alignment is nearly impossible in practice. Fortunately, the advent of Google Analytics 4 (or "GA4," formerly Google Analytics for App + Web) is an ideal time to approach a strategic measurement review.

Which came first, your tags or your measurement strategy?

Which came first, the chicken or the egg? Wikipedia refers to this question as a "causality dilemma"—we can't decide which event is the cause, and which is the effect.

Which came first, your tags or your measurement strategy?

Do any of these options sound familiar?

  • There is no strategy
  • The strategy and tagging bear no relation
  • The strategy is retrofitted to match the organically grown, free range, tag management

There is no shame in accepting that the strategy might not be up to date with the current tagging implementation. Tactical measurement is more volatile, for sure. Tag management is meant to help you move fast! However, lack of a strategy, significant disconnect between strategy and tagging, or strategy adapted to fit the tags (as opposed to the right way around) are not acceptable and must be addressed.

"Some people spend their entire lives waiting for the time to be right to make an improvement."

- James Clear, "Atomic Habits: An Easy & Proven Way to Build Good Habits & Break Bad Ones"

An opportunity presents itself

The advent of GA4 (formerly Google Analytics for App + Web) is an ideal time to approach a strategic measurement review. Don’t think this means you're going to throw away your existing Universal Analytics (UA) implementation and start again. Far from it. An existing reference point to work from is a valuable asset. You need to consider the following in your current tagging in order to decide the correct tactical and strategic alignment:

  • what currently works and aligns with strategy
  • what's currently broken and is misaligned
  • what's missing from tagging and/or the strategy
  • what's bloat and simply needs to be removed

Fix the broken stuff, fill in the gaps, and ditch the unnecessary to trim down and align your tagging and measurement strategy.

Connect measurement strategy and implementation

As a quick refresher, let us recall what is meant by a "measurement strategy":

  • Goals
  • Audiences
  • KPIs

A measurement strategy is a formalisation of what is measured, why, and what success criteria look like. The lack of an objective set of measurements is a key cause of digital marketing failure. Accepting that the current measurement implementation and strategy need to be reviewed and adjusted, this provokes a number of questions:

  • How did we end up here?
  • How do you fix it?
  • Why do you fix it? What’s the value?
  • How often do you realign strategy and measurement?

In the absence of any formalised process for tactical and strategic data alignment, measurement tactics will naturally diverge from the ideal mandated by the organisational aims. A good starting cadence for a process to address this issue is quarterly. This will be driven by the pace of change in your tag management, rather than your organizational strategy.

Start now.

Industry guru Avinash Kaushik has already written what needs to be written on measurement strategy so I won't repeat it here. The golden opportunity at hand is to reflect on the legacy measurement, consider what is possible with GA4 and ensure that the next generation of digital analytics instrumentation is as aligned with your global strategy as possible. Go beyond "fit for purpose" and strive for "OMG, this is digital marketing performance visibility I never thought possible!"

Priceless advice—don't get this bit wrong

When you embark on this process, be aware that UA tag types no longer exist. There is only one tag: an event. GA4 is event driven and user-centric. The GA4 core measurement is based on the concept of the event which means event name choice is critical to success. Use the GA4 event name to convey the meaning of the event. This needs strategic alignment of course, but, as much as possible, it is important to use the GA4 automatic, enhanced and recommended events before committing to a new custom event. This ensures the best/right reports are available for your data out of the box. Using customised event names might not enable all reports.

data diagram showing different outcomes

In conclusion

To not have a strategically aligned measurement approach is to court disaster. Recognizing that Google Analytics is changing, and in so many ways, for the better, is to embrace a fabulously valuable opportunity to address strategic alignment and remedy tactical issues in one swoop. Learn about GA4, and use it to plan the migration from UA. Build a measurement roadmap that complements the digital marketing plan. Be proactive, rather than reactive in measurement and strategy. Draw these components into a repeatable process, and ensure tagging remains aligned with strategy.

Learn how to implement Google Analytics 4 and align your data measurement and tagging strategies today. Google data analytics

Server-Side Google Tag Manager Deep Impact

Server-Side Google Tag Manager Deep Impact

4 min read
Profile picture for user doug_hall

Written by
Doug Hall
VP of Data Services and Technology

Server-Side Google Tag Manager Deep Impact

Before we dive into server-side Google Tag Manager (GTM), I’ll prefix the meat of this post with a caveat: always respect user privacy

Any data collection techniques discussed here must be applied righteously and not as a workaround to circumvent data collection consent regulation.


10,000 Foot View

Here’s a familiar situation - Google Tag Manager as we’ve known it for years.

Your container is loaded on all pages, or screens in your site/app, and based on trigger events, data is sent to first- and third-party endpoints.


server-side-phat-container-1.png

It works, it’s fine, but it’s not perfect. Tracking blockers, JavaScript failures, many, many requests to endpoints, and inefficient JavaScript are all risks, and potential performance problems that can lead to data quality issues.  

Server-side GTM moves the tag vendor request from the client to a server—a server on Google Cloud Platform living on a subdomain of your site. The container loaded in the browser/app still has tags and still sends a request but has way less code, sends fewer requests, isn’t necessarily affected by anti-tracking software, doesn’t send the user’s IP address to third-party tag vendors, and first-party cookies are correctly set in an ITP compliant manner.  


server-side-small-container.png


Out of the Box - What’s Cool?

There’s a lot to be excited about with server-side GTM in that, on the client side, it’s all very familiar—but way better! The “traditional” digital marketer can still set up their Facebook tag(s) with the same triggers, and deploy Floodlights as required. Same, same… but different.

As mentioned earlier, rather than sending data to the tag vendor endpoint, it’s sent to a subdomain. For example, if you’re on www.mysite.com, server-side GTM will send data to tracking.mysite.com, a subdomain you can have configured.  

And that’s great because…?

  • It respects user privacy: The user’s IP address isn’t sent to a third party.
  • It preserves data quality: Tracking prevention doesn’t happen on requests to your own domain.
  • It lightens code bloat from the client side: The tags require less work on the browser, shifting the workload to the server instead. This means what remains in GTM on the browser does less, so the site runs faster.
  • It consolidates requests from the client side: You can send multiple requests from the server based on one request from the client.

At MightyHive, we strongly advocate for focusing on what’s best for the user, not the ability to foil or circumvent anti-tracking software. Reminder: act righteously, not selfishly. As it stands now, data is collected, not captured. In the future data will be exchanged… Think about that for a minute.


Deeper Impact

Have you noticed that tracking requests are sent to your domain and not a third-party domain? The data collection workload is moved to your infrastructure.

Does that feel like just going back to web server logging? How different is this from web server logging?  

Very. 

Analytics data is formatted (sessionized), cleaned (PII removed), integrated (joined with data from Google Ads, Search Ads/Display & Video 360) and presented ready to perform its function: analysis and optimization of all aspects of the online business, which, let’s face it, is all about better marketing.  

Web server logs don’t collect all behavioral data. Typically, log-level data isn’t integrated with marketing channel data, meaning there’s no feedback loop for activation of the data. 

But! There are similarities between server-side GTM and web server logging. The web server receives a request, typically for a page, builds the page content and responds, possibly setting first-party cookies along with the response. The server-side GTM endpoint also receives requests, and responds, potentially with cookies (but with less content).

Now… the web server knows what page it’s returning.

It knows what data to render on the data layer to record a transaction (for example). 

The data layer is picked up by a tag firing in the browser and then sent back to the tracking endpoint. 

The end point then takes the same data and fires it off to Google Analytics (GA) to complete the round trip and get your analytics data recorded. 

Phew!

Wait one minute. If the web server knows it’s rendering a “thank you” confirmation page, and it knows what data to render on the data layer, why bother sending this to the browser for the browser to just send it back to the tracking end point and then to GA?  

Why not remove some steps for efficiency? The web server knows it is rendering a confirmation page. So it builds the exact same request the browser was going to, and sends the GA transaction data straight to the tracking end point. Cut out the client round trip.

It’s quite normal to fire off conversion tags, Floodlights, FB pixels, Adnxs, TTD, and so on to record transactions. Don’t send those to the client to handle. As the web server responds with the confirmation page, send those requests straight to the tracking endpoint. The endpoint responds with the details of the cookies to set, and the web server sends those with the confirmation page content in the response to the client.


server-side-no-container.png

Think how many marketing tags and tracking pixels fire on page level events. How many tags actually need to fire on the client? How many tags don’t even need to be exposed to the browser? What if, just maybe, you only had page-level event-triggered tags? Maybe you only need page-level tracking if you’ve removed all of your data bloat? Then you don’t need to CNAME the tracking subdomain, you can restrict access to your tracking endpoint to only allow your web server to access it via https (think IP range restriction). That’s a bunch less complexity and a fair amount of moving parts removed from the solution.

Simpler is better. No code is better than no code, as the saying goes.


In Conclusion

The server-side GTM solution offers a good and correct solution to digital analytics measurement. It’s good because data quality can be improved, user privacy is further protected, and significantly, it’s a step towards doing less work in the browser, meaning sites and apps get faster.

Thinking about the possible solutions the technology offers, with the right motivation in mind, demonstrates how versatile the solution is, how much power is available and what avenues are still to be explored to leverage first-party data.


Gather data collection techniques that you can put into practice and apply righteously while respecting user privacy. data privacy data analytics Google

Digital Hygiene: Fighting Data Bloat

Digital Hygiene: Fighting Data Bloat

4 min read
Profile picture for user Julien Coquet

Written by
Julien Coquet
Senior Director of Data & Analytics, EMEA

Digital Hygiene: Fighting Data Bloat

Some years ago, as digital storage grew more affordable, the attitude towards data by many companies was to “store everything.” Every. Single. Data. Point. 

Next came “big data” and cloud computing, which brought even more data, more computing power, and ostensibly more opportunity and insights.  As a result, data consumption skyrocketed, driven by the Internet, social networks, and digital services.

To paraphrase my guru Avinash Kaushik, we now have more data than God ever intended anyone to have. 

The instinct to store everything is understandable. Why throw away data? But there have been a few unforeseen effects:

  • It increases the workload associated with data quality assurance
  • It increases data processing times
  • It makes data sets more complex and more difficult to work with
  • Most of the data is irrelevant to business analysis

The decision to keep all the data was an easy one. Discerning which data points should be considered is difficult. This consideration phase will be implemented either as companies are specifying a data project (BEFORE), or as they introduce a new release of their digital assets (AFTER).


For mature audiences only

Imagine you’re building the specification for your project and figuring out how to measure project success. You will most likely consider the following KPIs:

  • Key feature usage rate (conversion rate)
  • Marketing effectiveness (budget, cost per acquisition)
  • Vanity metrics (volume, users)

Sounds too basic? Fair enough. And yet that’s a great base to work from! 

Important Tip: Your project must be in sync with your organization’s maturity level.

First, you need to make sure the basic data you intend to collect from your site or app resonates with your product managers, your marketing team, or your analysts. They need to understand how these basic numbers can help shape your product or marketing strategies. 

Then, a specification document must be established. A Data Collection Bible of sorts. Call it a tagging plan, a data collection blueprint, a solution design document… get creative! That document will not be set in stone. It will evolve with your company as you enrich your data set to meet your measurement requirements. Make sure to include significant stakeholders in that process, or else...

Only after you’ve gone through a thorough data specification phase can you consider enriching your data during subsequent development cycles. Data enrichment will either be:

  • Vertical: more metrics to measure specific user events
  • Horizontal: more dimensions/attributes to give metrics more context

Keep enriching your data to assess the KPIs that support the measurement of your business objectives. Give them as much context as you can so the analysis is as relevant and actionable as possible.


Does your data spark joy?

All this talk about enriching your data sounds great, but you may be at a stage where you’ve collected way too much data already. Arguably, getting a ton of data means getting the fuel to power machine learning, artificial intelligence, or any reasonably advanced data processing.

Having said that, too much unidentified/non-cataloged data will ultimately yield confusion and storage/processing costs. For instance, if you have a contract with a digital analytics vendor (say Adobe or Google), it is very likely you’re paying a monthly/yearly subscription fee based on the number of hits your system collects and processes into reports, cubes, and miscellaneous datasets. Additionally, digital marketing teams are not known for questioning the status quo when it comes to data and tracking, in particular.

If you combine both facets of data cleanup, we’re looking at an optimization campaign that turns into a cost-saving effort. This is where you as a company should start asking yourself: “do I really need that data? Can my team function without measuring metric X and attribute Y?”

To borrow from Marie Kondo’s konmari method, you should keep only data points that speak to the heart. Identify metrics/attributes that no longer “spark joy," thank them for their service before brutally disposing of them with a firm and satisfying press of the DELETE button.


How can you tell whether you should discard a specific data point?

This requires a bit of investigation that can be done in your data repository by looking at your data structure (column names and values for instance). If you cannot make up your mind, ask yourself whether one particular data point really “sparks joy,” or in our case, drives analysis and can be used as a factor in machine learning. In fact, this is a great occasion to actually use machine learning to find out! 

Feed your data set into R/Python (insert your favorite machine learning package here) and look at the results:


Chart 1

You could also look at factor analysis another way and see where a specific factor really contributes to performance, metric by metric:


Factor Analysis

Once you’re done analyzing which data points still belong in your data architecture, it’s time for pruning. If you have made the decision to delete existing data, this can be as simple as deleting a column or a set of entries in a database, data lake, or data repository. But that’s only for data you already collected. What about data collection moving forward? 

If you want to change the way data is collected, you need to go konmari on your digital assets: web site tracking, mobile SDKs, OTT devices. Using a tag management system (TMS), you can start by deactivating/pausing tags you no longer need before safely deleting them from future versions:


GA Universal ID

From a management perspective, stakeholders need to make themselves known and express clear data requirements that can easily be retrieved. That way, when you prune/retire data that is deemed to no longer spark joy, you’re not inadvertently sabotaging your colleagues’ reports.

And this is why you needed that Data Collection Bible in the first place!

Which data stage are you at? Before or after? Basic or complex?

Find out how to implement a data tagging strategy and how to discern what data is most important to your project success. data analytics data privacy Google

Apple, Google, Privacy, and Bad Tech Journalism

Apple, Google, Privacy, and Bad Tech Journalism

5 min read
Profile picture for user Julien Coquet

Written by
Julien Coquet
Senior Director of Data & Analytics, EMEA

Apple, Google, Privacy, and Bad Tech Journalism

Wait, did they just say Safari now blocks Google Analytics?

(Spoiler alert: it doesn’t)

At the 2020 edition of the Apple Worldwide Developers Conference (WWDC), Apple announced that the new version of MacOS (nicknamed Big Sur) would ship with version 14 of the Safari web browser - promising Safari would be more privacy friendly. Which is a great move and in line with the regulatory and digital marketing landscapes.

However, based on fuzzy, out-of-context screenshots shown during the announcement, some digital marketing publications started asserting that the new Safari would block Google Analytics.

[Narrator’s voice: it didn’t]

Here are some of the articles in question:

Within minutes, that poorly researched bit of fake news was all over social media.

So what really happened? Should you worry?

Cooler heads always prevail, so let’s take a step back and look closely at what really happened.

What is ITP and why does it matter?

The WWDC is generally the occasion for Apple to announce new features and key developments in their tech ecosystem from desktop and mobile operating systems to SDKs, APIs, and all that good technical stuff.

In recent years, Apple has used the WWDC to announce changes to the way they handle privacy in web and mobile apps, namely with initiatives such as ITP (Intelligent Tracking Protection), which is used in Safari, Apple's Webkit-based browser on Macs, iPhones, and iPads.

In a nutshell, ITP restricts the creation and the lifetime of cookies, which are used to persist and measure someone’s visit on one site (first party, a.k.a. 1P) or across multiple websites (third party, a.k.a. 3P). ITP makes things more difficult for digital marketers because users become harder to track and target.

If we use Google Analytics as a comparison, ITP can "reset" a known visitor to a new visitor after only a couple of days, instead of the usual 2 years - assuming users don’t change devices or clear their cookies.

If we look at ITP with our privacy hat on, even collecting user consent will not stop ITP from neutralizing cookies.

ITP arrives at the right moment; just as online privacy starts to finally take root with pieces of legislation such as GDPR and ePrivacy in Europe, CCPA in California, LGPD in Brazil, APA/NDB in Australia, APP in Japan, PIPA in Korea, and a lot more being made into bills and/or written into law.

Arguably the above pieces of legislation allow for the collection of user consent prior to collecting. So we should not really be worrying about Safari potentially collecting information that users consented to, right?

That was not even a consideration in the aforementioned pieces on "Safari blocks Google Analytics."

Does the new Safari really block Google Analytics?

(Second spoiler alert: it still doesn't)

The most obvious way to show you is with a test. Luckily, I had MacOS Big Sur beta installed so I took a look under the hood - especially on the sites that published that "Safari blocks Google Analytics" story. Let's fire up Safari and turn on developer mode.

Bad Tech Journalism

Sure enough, Google Analytics sends a tracking call that makes it home to Google collection servers. Safari does not block Google Analytics.

Now let's take another look at that new privacy report: it shows "22 trackers prevented."

Wait, the list shows google-analytics.com?! Didn't we just establish that Google Analytics tracking went through?

Let's clarify: what the panel below shows are the domain names of resources loaded by the page that are flagged in the ITP lists as potential tracking vectors using third-party cookies.

Bad Tech Journalism

Other than that, ITP plays its role in drastically reducing the Google Analytics cookie’s lifetime to just a week as shown below.

Bad Tech Journalism

Let's drive this point home again if needed: Safari 14 does not block Google Analytics.

ITP is enforced as per the spec by blocking third-party cookies and limiting cookies to a lifetime of a week at most.

So what's the big impact?

As mentioned, ITP is primarily going to reduce the time during which a visitor is identified. After a week, ITP deletes/resets the user cookie and the visitor is “reborn”. Not a great way to study user groups or cohorts, right?

If you’re worrying about the impact of ITP on your data collection, may I suggest reading this awesome piece on ITP simulation by my colleague Doug Hall.

What is important to remember is that Apple is using ITP block lists built in partnership with DuckDuckGo, a search engine that has made a name for itself as a privacy-friendly (read: anti-Google). I, for one, have yet to see what their business model is but that’s a story for another post.

At any rate, ITP lists are meant to block cookies for specific domain names.

Even if Apple did decide to block Google Analytics altogether, how big a deal are we talking about? According to StatCounter, Safari accounts for roughly 18% of browser market share (as of June 2020). Let's round this up to a neat 20%. That’s an awful lot of data to lose.

Arguably, Google Analytics wouldn’t be the only tracking solution that could be impacted. Let’s not forget about Adobe, Criteo, Amazon, Facebook, Comscore, Oracle—to name a few.

So if you keep implementing digital analytics according to the state of the art, by respecting privacy and tracking exclusively first-party data, you'll be a winner!

Is it really just bad tech journalism?

Let's get real for a moment. If tech journalists posting the story about Safari blocking Google Analytics knew about ITP, they wouldn't have published the story - or at the very least with a less sensational headline. Even John Wilander, the lead Webkit engineer behind ITP spoke out against the misconceptions behind this "Safari blocks GA piece."

This is unfortunately a case of bad tech journalism, where half-truths and clickbait titles drive page views. Pitting tech giants Apple and Google is just sensational and does not highlight the real story from WWDC: privacy matters and Apple are addressing it as they should.

In this, I echo my esteemed colleague Simo Ahava in that this kind of journalism is poorly researched at best, intentionally misleading at worst.

Most of the articles on this particular topic backtracked and offered "updates" but they got caught with their hand in the cookie jar.

To be fair, it is also Apple's fault for using misleading labeling.

But is it so bad considering we’re talking about a beta version of a web browser? Ìf anything, Apple now has a few months ahead of them to make adjustments before Big Sur and Safari.

Beyond the fear, uncertainty and doubt, this kind of publication is symptomatic of an industry that is scared by the effect that privacy regulation is having on their business.

How is MightyHive addressing this?

While we at MightyHive have long been preparing  for the death of the cookie and digital ecosystem focusing on first-party data, we can appreciate that initiatives such as ITP can make a digital marketer's life very complicated.

We strongly believe that the future of digital marketing lies in first party data, consent and data quality.

Cookies are on their way out but this does not mean the end of the world.

We compare both Apple and Google's privacy updates that are in line with the regulatory and digital marketing landscapes of today. Google data analytics data privacy

Identifying Significance in Your Analytics Data

Identifying Significance in Your Analytics Data

3 min read
Profile picture for user doug_hall

Written by
Doug Hall
VP of Data Services and Technology

Identifying Significance in Your Analytics Data


What is significance?

Making decisions based on data needs the support of a robust measure of confidence in the data.

Off the back of an event of some sort (campaign starts, new app feature, global pandemic), if we observe any change in our data we need to be confident the "thing" that happened was actually responsible for the change in data—not just a correlation. We need to be able to demonstrate that had this thing not happened, the data wouldn't have changed.

Then we can infer a causal relationship between the event and the change in the data. Remember—it's still a probability, we can never prove causality in a categorical sense, but we can be highly confident (and it's way better than guessing!). We can remove emotion and unconscious bias from decision-making. We don’t eyeball data or use our gut—mathematics informs the decision making process.

Here's the full chat and slides from last week's "Live with MightyHive" episode (scroll to the end for the slides):


How does it work?

The technology behind the Google CausalImpact R package that was demonstrated in the episode constructs a Bayesian structural time-series model and then tries to predict the counterfactual.

Simply, the mathematical model uses data prior to the event to predict what the data would look like had the event not happened. Important: the prediction is actually a probabilistic range of values. If the historic data is noisy, then the accuracy of the prediction will change. See the screenshot below from the demo walk through linked above. In the image below, the blue shaded area is the prediction (synthetic control estimator) from the model. If the observed data falls outside the blue region, we have significance!

Identifying Significance in Your Data


The blue region gets bigger with noisier data. The broader the blue region, the more extreme the observation will need to be in order to achieve a significant signal.


Using Google CausalImpact

You can use the CausalImpact package with as little as three lines of R. R Studio is open source or you could try it out using rstudio.cloud.


CausalImpact Package


Be advised, if you install the CausalImpact package locally, due to dependencies, you'll need at least v3.5 of R. I updated Linux on the Chromebook to get the latest version of R and R Studio via this very useful article and the package installation was very straightforward.

There's another option thanks to Mark Edmondson from IIH Nordic. Mark wrote a great Shiny app front end for CausalImpact that's free to use, so you can explore significance in your own GA data.


Using significance to establish causality and take action

We used the package to analyse client data to confidently answer key business questions that arose regarding KPI changes since the UK was locked down.

As well as considering YTD data (setting the 'event' as Jan 1), we use pre- and post-lockdown (Mar 9) date periods. Data shows clear patterns in purchase behaviour for retails sites. Media sites appear to exhibit explosive growth. However, the specifics regarding growth areas of content are highly informative—not what you'd expect to see by just eyeballing the data from afar.


CausalImpact Demo


For retail and media clients, the ability to identify current and future growth areas with confidence is a highly valuable tactic. At a strategic level, the forecast output from CausalImpact is highly actionable in driving campaign content, budgets, and timing.

While tactics for the current global situation include "managing," there is a clear near for preparation as well. Making decisions on current data and using forecasts with confidence proves to be valuable for our clients.


Additional Resources

Thank you for reading! The slides from the episode can be accessed here:


Watch the CausalImpact R package introductory video here (mandatory viewing!):

Making decisions on current data and using forecasts with confidence proves to be valuable for our clients. Learn how. data analytics data advocacy Google

The Sun is Setting on Third-Party Cookies and It’s Time to Move with the Market, Not Against It

The Sun is Setting on Third-Party Cookies and It’s Time to Move with the Market, Not Against It

4 min read
Profile picture for user simon_harris

Written by
Simon Harris

The Sun is Setting on Third-Party Cookies and It’s Time to Move with the Market, Not Against It

Google Chrome to Drop Third-Party Cookies

On January 15th, Google announced that third-party cookies would be blocked in Chrome by 2022. Over the past 24 months, increasingly aggressive iterations of Intelligent Tracking Prevention (ITP) in Apple products have challenged the third-party cookies used for measurement and targeting. However, Chrome currently commands a majority of desktop browser share globally, which makes Google's announcement significant for the industry. In the next 24 months, third-party cookies will become effectively unusable for advertising measurement.


browser-market-share-dec-2019.png


Based on current usage, by 2022 the market will be dominated by browsers that block some or all third-party cookies by default.


The Next Two Years

With this announcement and self-imposed deadline, Google will have to work out how their own ad platforms will interface with third parties, such as ad exchanges. The programmatic advertising ecosystem of which Google is a significant part of is based on third-party cookies. As things stand, Data Management Platforms (DMPs) will be significantly challenged. Likewise, view-based and today's multi-touch attribution (MTA) solutions are effectively moot. Many forms of third-party data, already challenged by government regulations like GDPR enforced in May 2018, will cease to exist.

Google has proposed a mechanism to allow for anonymized and aggregated measurement called the Chrome Privacy Sandbox which was announced in August 2019.


Sand What?

In August 2019, Google announced an initiative aimed at evolving the web with architecture that advances privacy, while continuing to support a free and open ecosystem. They call it a "Privacy Sandbox." Right now, these constitute a set of proposals for browser APIs that will eventually serve as privacy-preserving technical alternatives to third-party cookies.

There aren’t any tangible tools inside the Privacy Sandbox—at least not yet. Google said in their blog post that it aims to "eventually" build these tools with the industry over the next two years to ensure interoperability in the programmatic and ad tech ecosystem.


How Will We Target Audiences Without Cookies?

Third-party cookies have been used for everything from frequency management to behavioral targeting. How might marketers continue to employ these tactics moving forward?

Audience-based and user-level targeting have been the cornerstone of programmatic buying over the past decade. Indeed, the very concerns around ad targeting and user privacy contributed to Google's announcement.

There is every reason to believe that targeting will still be possible, as will attribution, but the mechanisms will need to radically change. The scale and scope of addressable audience targeting will decrease and advertisers may turn to federated learning, contextual targeting, and other techniques to drive business performance through programmatic platforms. Another suggested approach would be for the browser itself to segment audiences based on their browsing behavior, and once there are a sufficient number of other browsers in this interest group an advertiser could target them.

What about frequency management? In October 2019 Google introduced frequency management across bid requests without a third-party cookie associated with them. Instead, Google employs machine learning to analyze behavior from across their ad inventory and provide an estimate with a high degree of confidence the number of impressions an individual had been exposed to.

Lastly, publishers with first-party audience relationships are poised to fill in audience targeting gaps left by the removal of third-party data cookies. For example, this would include a publisher with a paywall that requires a user to login to read content. Publications are likely to sell more curated inventory packages (here's an example from Meredith), much of which will be available programmatically via private marketplaces (PMPs) and programmatic direct/guaranteed deals.


programmatic-direct-digital-display-ad-spending-us-2016-2021-emarketer.png


Spending on programmatic direct channels has grown significantly in recent years and is expected to continue climbing.


How Will We Measure?

Conversion tracking will become increasingly difficult to measure using current approaches, but there are several solutions available now and on the horizon. For example, as Campaign Manager log-level data loses fidelity, solutions like Google Ads Data Hub stand to open up new possibilities with more durable data and more privacy-safe methodologies. Likewise, platforms like Amazon and Facebook are working on similar solutions.


data-clean-room-example.png


Source: "The New Possibilities of an ID-Redacted World"

Google's proposal for a conversion measurement API would allow for click-based attribution without using cross-site trackers. Trials for click-based conversion measurement sans third-party cookies will start by the end of 2020. Read more on the Chromium Blog and in AdExchanger.

What about view-based conversion tracking? Most current approaches will cease to work in any major browser once Chrome deprecates third-party cookies, but Google has indicated that the future of measurement may be more probabilistic or panel-based. Whether this will allow for view-through conversion tracking remains to be seen.


How MightyHive Will Adapt

As with many businesses in the programmatic space, a number of MightyHive services are built to some extent on top of the third-party cookie, such as programmatic audience activation, dynamic creative, and advanced attribution.

In their current state, these technologies will not work in two years’ time. However, there is every reason to believe that ad tech will continue to innovate and adapt with these changes opening up new opportunities for more advanced and smarter marketers in a new cookie-less era.

  • We have already started developing targeting and measurement approaches independent of cookie-based approaches for use on multiple bidding and measurement platforms. Further, as a leading Google partner, will be collaborating closely with Google on the Privacy Sandbox protocols and work hard to bring these solutions to our clients.
  • MightyHive has deep, holistic consultative expertise to bear on these challenges. For example, we have invested heavily into data science, API and Cloud-driven solutions to help marketers gradually increase the utility of their first-party data while simultaneously reducing reliance on third-party cookie pools.
  • As part of S4Capital, with our sister company MediaMonks, our clients are exploring end-to-end digital strategies that leverage first-party data to drive content and programmatic media.

We argue consumers should always be the first constituent in considering the digital advertising experiences online and adapting to this shift requires marketers to place more attention on the value exchange traded for a consumer's attention. The key will be to move with the market, as opposed to push against it and seek short-term fixes.

As always, MightyHive is your partner and your advocate.

Very soon third-party cookies will become effectively unusable for advertising measurement, and it's time to move with the market. data privacy data analytics third-party cookies first-party data

Choose your language

Choose your language

The website has been translated to English with the help of Humans and AI

Dismiss